
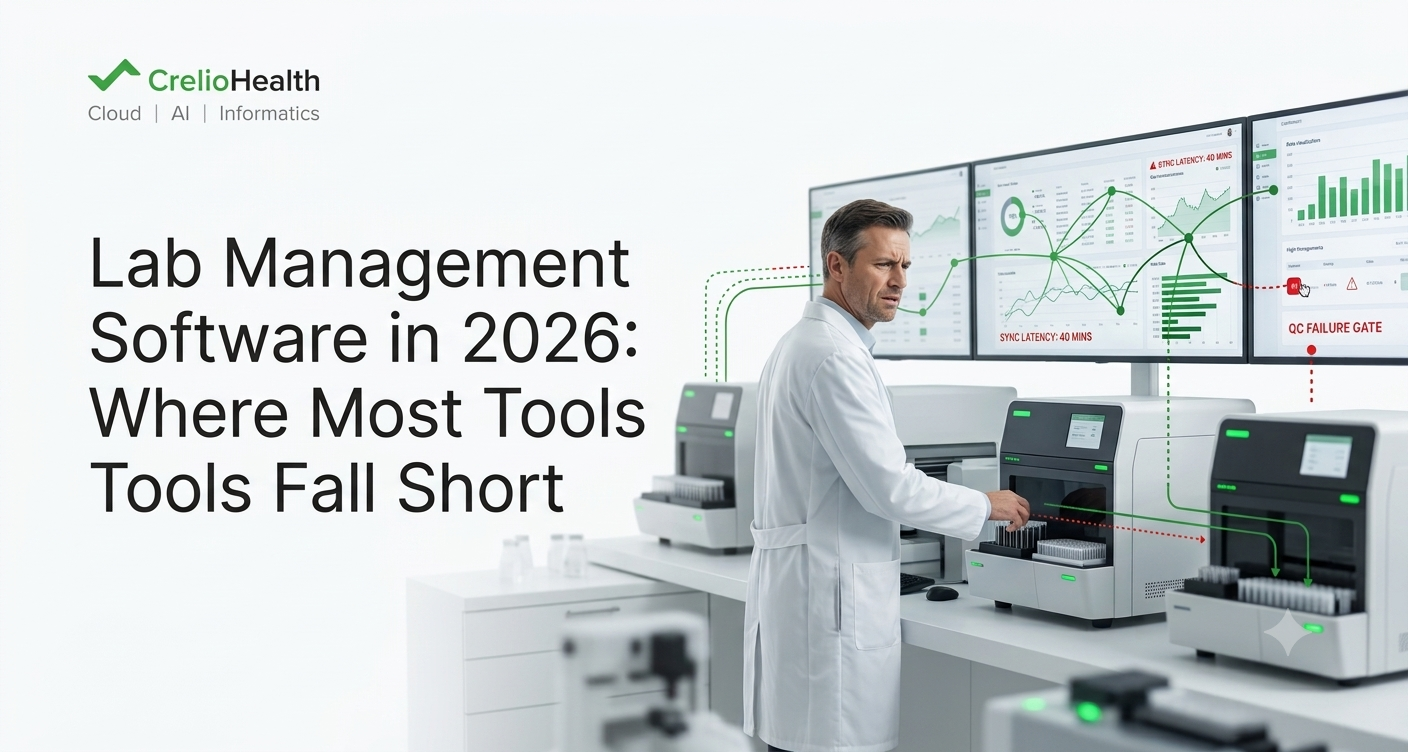

In the lab room, it’s six weeks after go-live, and the dashboard still looks the way it did in the demo. The lab director still looks at Lab Management Software to figure out what to do next. That’s the problem. The lab director who signed off on this platform sat through a ninety-minute walkthrough, and every question got a confident answer. The sales engineer clicked through sample intake, QC flags, and a results dashboard that updated in real time. Clean. Fast. Convincing.
Six weeks in, the instrument sync is running forty minutes behind the bench. The audit trail lives in two systems that don’t talk to each other. The QC dashboard says one thing. The analyzer floor says another. Nothing has crashed. Nothing has thrown an error. The system is just quietly, persistently wrong in ways that only show up once real volume, real audits, and real multi-site chaos hit it.
Here’s a pattern worth naming: most lab management software is built to pass a demo. This article is about what you have to do after you sign up.
1. What Lab Management Software Is Actually Being Asked to Do in 2026
A lab management system in 2026 isn’t managing a lab. It’s managing a diagnostic business. Multiple revenue streams. Multiple collection sites. Regulatory obligations that simply didn’t exist in the same form a decade ago.
The Job Description Nobody Rewrote
That shift happened quietly. Ten years ago, “lab software” meant sample tracking and result reporting; that’s it. Today, a mid-sized diagnostic lab runs a dozen or more software-dependent workflows in a single shift: accessioning, instrument result capture, QC rule evaluation, delta checks, physician result delivery, patient billing, insurance reconciliation, inventory reorder triggers, referral routing, home collection scheduling, regulatory reporting, and audit documentation.
Often across more than one site. Each of those used to be a manual process with a software assist. Now each one is a software dependency. If the software doesn’t do it, it doesn’t happen.
Six Layers, One Data Model Or Five Stitched Together?
Most platforms on the market were built for a lab that no longer exists: single-site, moderate volume, sample tracking as the main job. Since then, they’ve had features bolted on to keep pace. A billing module here, a multi-site login there, a compliance export tool wherever an auditor complained loudly enough. The result looks complete in a demo. It shows you all six operational layers a modern lab needs. What it usually can’t show you is whether those six layers run on a single data model or on five stitched-together ones.
The six layers, for reference:
- Sample lifecycle management – accessioning through to result delivery
- Instrument integration – real-time, two-way analyzer connectivity
- Compliance architecture – audit trail, QC enforcement, accreditation readiness
- Patient and order management – one identity across every touchpoint
- Revenue cycle – billing and reconciliation tied to clinical data
- Real-time reporting – visibility across sites and shifts
The Evaluation Mistake That Costs You 18 Months Later
Here’s the evaluation mistake most labs make: they buy for the layer they’re weakest in today, and never check whether the other five were built natively or stitched on. Labs struggling with TAT buy for instrument speed. Eighteen months later, at their first NABL or CAP inspection, they discovered the audit trail was a separate log file the whole time. So the real evaluation question isn’t “does it have this feature?” “Which of these six layers does this platform own, and which ones are running through middleware that nobody mentioned in the demo?”
2. The Non-Negotiable Feature Set: What to Demand Before You Sign
Every vendor demos sample tracking, result entry, and a QC dashboard. That’s table stakes. That’s not where your evaluation time should go. What separates a platform that holds up from one that quietly fails is a shorter list and capabilities that only get stress-tested after go-live.
Real-time instrument sync
QC status has to match floor status within minutes. Not on a batch refresh cycle. An accurate dashboard but forty minutes late isn’t accurate; it’s just late.
Unified patient and sample identity
One record. One identity. Every workflow. If your staff is manually matching a patient record between the front desk and the lab, you don’t have unified identity. You have two databases and a search bar between them.
Native audit trail
Every action attributable. Every state change preserved. No manual export step is required. A log file is not a compliance architecture; it just looks like one in a demo.
Configurable workflows without code
New test types, new QC rules, new collection sites, configured by your lab staff on a Monday afternoon. It’s not queued behind a developer ticket that takes three weeks to clear.
Integrated billing
Financial data lives in the same data model as clinical data. Revenue leakage shows up as it happens. Not at month-end reconciliation, once it’s too late to do anything about it.
Multi-site visibility
A single operational view across every collection point and processing labs. Not a site selector bolted onto a system that was only ever built for one site.
Regulatory readiness, built in
CAP, NABL, and ISO 15189 requirements reflected in the architecture itself. It’s not addressed through a compliance checklist someone bolted on after the fact.
| Features | Ask this in the demo | Red flag answer |
|---|---|---|
| Real-time instrument sync | “What’s the actual latency under peak load?” | “It refreshes every 30–60 minutes” |
| Unified patient identity | “Is this one record, or two matched records?” | “Our system matches records across sites.” |
| Native audit trail | “Can the system prevent a non-compliant action?” | “We log every action for you to review” |
| Configurable workflows | “Who can configure a new test type, and how fast?” | “Our team can turn that around in a couple weeks.” |
| Integrated billing | “Who sees a billing error first?” | “Billing runs on its own reporting layer” |
| Multi-site visibility | “Show me one audit trail across a site handoff.” | “Each site has its own login and dashboard” |
| Regulatory readiness | “How does the data model satisfy this requirement?” | “We have a compliance module for that.” |
Notice the word that shows up in every red-flag answer: “module.” Whenever a capability gets described as a module, an add-on, or a layer sitting on top of the core platform, it usually means the underlying data model was never built to support that function. It will behave differently under real-world stress than it did in a demo with three sample records in it.
3. Where Most Lab Management Tools Quietly Fail: Throughput
All lab management software performs fine at pilot volume. The failure shows up later, once a lab that ran 200 samples a day during evaluation is running 800, and the same system that looked instant six months ago is now visibly behind the bench.
What Throughput Failure Actually Looks Like
This is a throughput failure pattern. Instrument queues back up. Result: turnaround time creeps past SLA. The dashboard lags floor reality by minutes that turn into tens of minutes under load. Ask the vendor what’s happening, and the standard answer is a hardware upgrade: more server capacity, a faster database. That answer is usually wrong. The problem isn’t the hardware. It’s architecture.
The Real Culprit: Polling, Not Hardware
Most entry-level lab platforms run on synchronous, poll-based instrument integration. The system checks in on each analyzer at a fixed interval instead of receiving results the moment they happen. At low volume, polling is invisible. You’d never notice it. At high volume, every poll cycle adds latency, and that latency compounds across every connected instrument. The gap between what the system shows and what’s happening on the bench widens with every sample you add.
The Staffing Tax Nobody Budgets For
The pattern is predictable. A platform passes a 200-sample-a-day pilot cleanly. The system will be deployed into production running 600–800 samples a day within six to twelve months. TAT degrades measurably at exactly the volume where polling architecture runs out of headroom. Labs going through this rarely blame the software directly. They add headcount instead, a manual reconciliation shift to double-check what the dashboard says against what the analyzer logged. That staffing cost never showed up in the original evaluation. It’s the clearest sign that a throughput failure has already happened, quietly, months ago.
What High-Throughput Labs Actually Need
What high-throughput labs need is event-driven instrument integration through which results are pushed the moment they’re generated, not polled for on a schedule, plus asynchronous processing and configurable priority queues, so a STAT sample doesn’t sit behind a batch of routine chemistry.
In a demo, ask for real performance data, not projected capacity. Any vendor can claim their platform “scales.” Few can show you TAT performance from a live customer running your target volume, sustained over months rather than a three-week pilot.
4. Where Most Tools Quietly Fail: Compliance and Audit Trails
The discovery moment usually happens right before an inspection. A lab preparing for NABL or CAP accreditation pulls its documentation together and realizes the audit trail isn’t in the LIMS. It’s in a separate log file that was never linked to the sample records it’s supposed to account for. Preparing for the audit now means cross-referencing the two systems by hand, sample by sample, to reconstruct a chain of custody that should have been continuous from day one.
Log Records. Architecture Prevents.
That gap comes down to a distinction that’s easy to miss in a sales demo but impossible to miss during an inspection: an audit log records what happened. A compliant-native architecture makes it structurally impossible for a non-compliant action to occur in the first place. They are not the same capability. Only one of them holds up when an inspector asks a pointed question.
Three Ways Compliance Quietly Breaks
- The audit trail is stored separately from operational data. Sample events live in one table. Compliance events live on in another. Reconstructing a chain of custody means a manual join, performed correctly, under time pressure, by whoever’s on shift that day.
- Compliance depends on staff discipline rather than system enforcement. The QC-before-signout rule lives in a training document, not in the software’s logic. It holds only as well as the least attentive person on shift.
- Compliance reporting requires exporting and reformatting instead of real-time generation. If producing an inspection-ready report means someone spends an afternoon in a spreadsheet, the “compliance module” is doing paperwork. It isn’t doing enforcement.
What Compliance-Native Actually Looks Like
A genuinely compliance-native architecture treats every sample state change, every instrument reading, and every result sign-off as a first-class data event: user identity, timestamp, and prior state are carried as part of the record itself, not as a side log. Nothing needs reconstructing after the fact, because nothing was ever separated in the first place.
This is also where the phrase “compliance module” deserves real scrutiny during evaluation. If compliance is something a vendor has added on top of their core data model, it is, by definition, not native to it. NABL, CAP, and ISO 15189 all expect traceability and non-repudiation at the level of individual data events. A bolt-on log file rarely satisfies that expectation as cleanly as it appears to in the demo.
The single most revealing question you can ask: “Show me how your system prevents a sample from being signed out without a completed QC check.” If the honest answer involves a report someone reviews after the fact, you’re looking at a log. Not architecture.
5. Where Most Tools Quietly Fail: Multi-Site Operations
The failure shows up the moment a lab succeeds enough to expand. The lab adds a second collection centre. Connect it to the same LIMS everyone already uses. And discovers that the platform was quietly built around a single-site assumption all along. Sample IDs collide across sites. QC rules configured at the original location don’t propagate to the new one. The operations manager who used to have one dashboard now juggles two separate system views, stitched together with spreadsheets and phone calls.
Why the “Multi-Site Module” Doesn’t Fix It
This single-site assumption runs deeper than the site selector in the UI would suggest. Underneath, this often means separate databases per site, separate user management per site, and no formal handoff protocol for a sample that moves between locations. Bolting on a “multi-site module” that adds a dropdown to the top of the screen doesn’t change any of that. It just makes the isolation harder to notice, until a sample crosses a site boundary and the seams show.
What a Real Multi-Site Architecture Requires
True multi-site operation requires a different foundation: a single patient identity, recognized across every site. Cross-site sample tracking with a formal handoff event when a sample moves from collection to processing. Centralized QC rule management that still allows site-specific exceptions. Consolidated reporting that drills down to individual site performance without a separate login.
This matters most for diagnostic chains and franchise models, where site managers need real operational autonomy, their own staffing calls, their own local workflows, while the network still needs one compliance posture and one reporting view from the top. A platform that forces a choice between site-level flexibility and network-level control is usually revealing a choice that got made architecturally, long before any customer configured it.
The Cross-Site Test Every Vendor Should Pass
The test to run: ask the vendor to show you a sample collected at Site A, processed at Site B, and reported out to a referring physician, with a single, continuous audit trail across that entire handoff. If what you see instead is two systems with a manual reconciliation step in between, the multi-site capability in the demo was a UI feature. Not an architectural one.
A lot of diagnostic labs are actively planning to add collection sites in the next two years. So this isn’t an edge case reserved for large chains. It’s worth asking even if you’re only evaluating software for a single site today, because the architecture decision was made long before your second site was ever on the roadmap.
6. The Failure-Mode Checklist: Questions to Ask Before You Commit
You now know where lab software quietly fails. Here’s the exact set of questions to bring into your next vendor conversation, worded so they’re hard to answer with a demo-safe deflection.
- Throughput: “Who’s your largest active customer by daily sample volume, and can we talk to their lab director directly?”
- Compliance enforcement: “Walk me through how your system enforces a QC gate; not how it records that the gate happened, but how it prevents the next step without it.”
- Audit readiness: “If NABL showed up for a spot audit tomorrow, how long would it take your system to produce a complete chain-of-custody for a sample processed ninety days ago?”
- Multi-site identity: “Show me a cross-site patient record with the same patient, two collection sites, one processing lab, and prove identity is unified, not matched after the fact.”
- Instrument integration: “What’s the latency between an instrument finishing an analysis and the result showing up on your dashboard? What happens if that instrument goes offline for ten minutes?”
- Billing integration: “Where does a billing error surface, and who sees it first, the billing team or the lab team?”
- Configuration speed: “I need to add a new test panel with site-specific reference ranges and a custom QC rule. Who on my team can do that without your involvement, and how long will it take?”
Bring these seven questions to every vendor conversation on your shortlist. Ask them in this order: throughput and compliance first, since those two answers reveal architectural depth fastest. How specifically a vendor answers, and whether they’ll connect you with a live customer instead of a roadmap promise, tells you almost as much as the answer itself.
Central Asset: Where the Demo and the Deployment Diverge
| Capability | What most tools promise | Where it quietly fails |
|---|---|---|
| Real-time instrument sync | Live dashboard showing instrument queue status | Updates on a 30–60 minute polling cycle; floor state and system state diverge under load |
| Audit trail/compliance | Full audit trail for every sample event | Audit events sit in a separate log file, unlinked to sample records; requires manual cross-reference at audit time |
| Multi-site operations | Multi-site support with consolidated reporting | Site-level data isolation under the hood; patient identity is matched, not unified; cross-site handoffs require manual reconciliation |
| Throughput at scale | Handle your lab’s current and future volume | Tested at pilot volume; TAT degrades measurably above 600–800 samples/day without an architecture change |
| Instrument integration | Integrates with all major manufacturers | Runs through middleware or custom scripts; each new instrument is its own project, and failures are silent |
| Billing integration | Integrated billing and revenue cycle | Billing runs on a separate database; revenue leakage surfaces at month-end, not in real time |
| Configurable workflows | No-code configuration for new tests and QC | Requires vendor involvement or developer access; onboarding a new test type can take weeks, not hours |
7. What Modern Lab Management Software Should Look Like: The 2026 Baseline
Once you’ve run the probe questions, “good” stops being aspirational and starts being concrete
The Architectural Signals That Actually Matter
The 2026 baseline is a platform that covers all seven operational layers natively, on one data model, with no middleware stitched in to cover a gap. The architectural signals are consistent and checkable: event-driven instrument integration, not polling. Compliance enforcement is built into the data model, not layered on afterward. One patient identifier and one QC policy engine, no matter how many collection points feed into it. Configuration that your lab staff can do directly, without routing through a developer queue.
The 200-vs-2,000 Test
The clearest scalability signal is easy to overlook: the platform should perform identically at 200 samples a day and at 2,000. If performance depends on adding server capacity as volume grows, the constraint was architectural from the start. Hardware was only ever a temporary patch.
Why This Decision Compounds
The stakes compound over time. A lab management platform is typically a multi-year commitment, and most labs don’t replace core software casually, given the disruption and cost of migration. The labs that evaluated against architecture instead of demo polish in 2026 are the ones who won’t be back in 2028, re-shopping for the platform they should have picked the first time.
FAQ
What features should I look for in lab management software?
Beyond the standard checklist: sample tracking, result management, QC; the features that matter most after implementation are real-time instrument sync (not polling-based), a native audit trail built into the data model, unified patient identity across every site, and billing integration on the same data model as clinical data. Most platforms demo well on the standard list. They fail specifically on the real-time and multi-site requirements.
Why does lab management software break at scale?
Most platforms are designed around single-site operations at moderate throughput. At scale, multiple sites, 500 to 1,000+ samples a day. The failure modes are architectural: polling-based instrument sync falls behind floor state, single-site data models create reconciliation problems across collection points, and compliance that depends on staff discipline instead of system enforcement breaks down under pressure. The fix is architecture, not more hardware.
What are the most common limitations of lab management software?
Five limitations consistently surface only after go-live: instrument sync latency under high throughput, audit trails that behave like log files instead of native data events, multi-site data isolation that requires manual reconciliation, compliance steps that depend on staff discipline instead of system enforcement, and billing data running on a separate system, which makes revenue leakage invisible until month-end.
How do I evaluate lab management software for a high-throughput lab?
Ask vendors for performance data from live labs running at your target volume, not pilot environments. Probe instrument sync latency under load, TAT performance at 800-plus samples a day, and how the system behaves during instrument downtime. Require a reference conversation with a lab director running comparable volume. And treat a hardware-upgrade answer to a throughput question as a red flag, not a solution.
Conclusion
Buying lab management software on the strength of a demo is a multi-year commitment based on ninety minutes of polished UX. Using the failure-mode framework in this article means buying architecture instead. And architecture is what determines whether a platform grows with your lab, or gets replaced when your lab outgrows it.
Three things worth carrying forward. Most lab software is built to pass a demo; the features that matter are the ones that only surface after go-live. The failure modes are predictable: throughput collapse, audit-trail fragmentation, multi-site isolation. Every one of them is testable before you sign. The question that protects you isn’t “does this software have this feature?” It’s “does this software have an architecture that lets the features hold up at my scale?”

