
1. Introduction To Blood Chemistry Testing
Blood chemistry tests are essential for diagnosing, preventing, and managing a wide range of diseases. In this exploration, we delve into the intricate world of blood chemistry, a vital aspect of medical testing that provides valuable insights into one’s overall health. Blood Chemistry Test Interpretation monitors the effectiveness of treatments and identifies potential side effects.
-
Need of a User-friendly Visual Guide for Testing and Interpreting Blood Chemistry Results
Blood chemistry tests generate a wealth of data, which can be challenging to interpret. This is especially true for healthcare professionals who are not familiar with the specific tests or patient demographics. Additionally, a user-friendly visual guide can simplify the blood chemistry test procedure, providing a clear and concise overview of key results.
Moving further, this blog post aims to empower decision-makers with a comprehensive visual guide with blood chemistry test results explained in better ways.
2. Understanding Blood Chemistry Results
I. What are Blood Chemistry Tests?
Blood chemistry tests measure a wide range of substances in the blood, including electrolytes, enzymes, hormones, and proteins. Further, these substances play essential roles in various bodily functions. Also, their levels can be affected by a variety of factors, such as diet, exercise, lifestyle, and medical conditions.
II. Types of Information Derived from Blood Samples
Blood chemistry tests can provide information about a person’s overall health. Also, this includes specific aspects of their health, such as kidney function, liver function, and blood sugar control. So, understanding Blood Chemistry Results better can be helpful to diagnose and monitor a variety of medical conditions, such as diabetes, heart disease, and cancer.
III. Common Blood Chemistry Parameters Measured During Testing
Some of the most common parameters measured in blood chemistry tests include:
A) Hematology parameters: These parameters measure the different types of blood cells and their levels.
B) Metabolic parameters: These parameters measure substances involved in metabolism, such as glucose, cholesterol, and triglycerides.
C) Biochemical parameters: These parameters measure proteins and enzymes that are vital for various bodily functions.
IV. The Significance of Reference Ranges
Reference ranges are provided for different blood chemistry parameters. These ranges represent the normal levels of these substances in a healthy population. However, it is important to note that reference ranges can vary depending on factors such as age, sex, and pregnancy status.
3. The Visual Blood Chemistry Results Guide: A Quick Overview
I. Visual Representations for Standard Blood Chemistry Parameters
Visual representations, such as blood test results charts and graphs, can be used to simplify the interpretation of clinical laboratory tests blood chemistry. For example, to compare the glucose levels of different patient groups a bar chart for blood test results can be used, while a line graph can be used to track cholesterol levels over time.
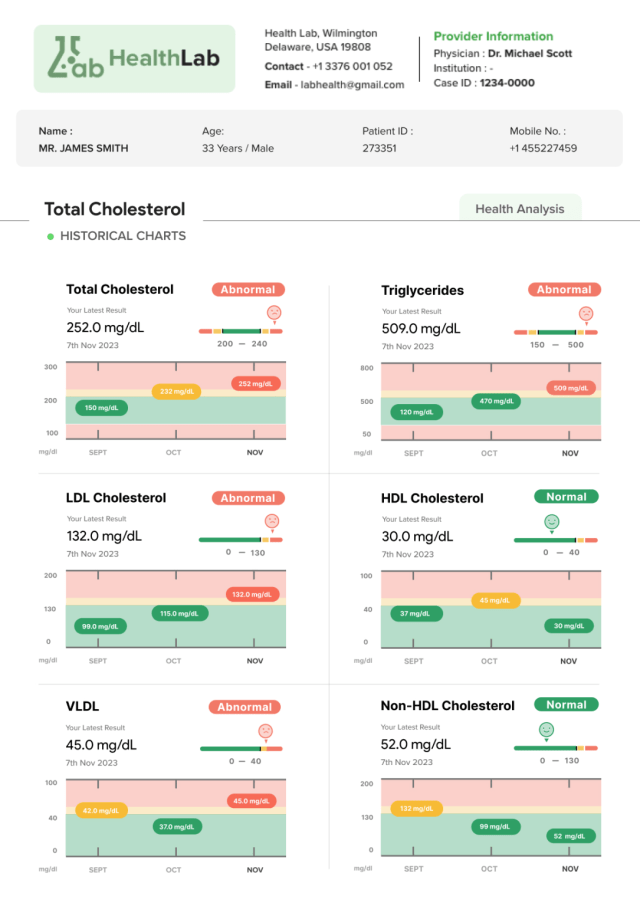
Here’s a sample blood chemistry test results chart for a better understanding of the provider and patients.
II. Benefits of Using Charts and Graphs for Interpreting Blood Chemistry Results Data
Blood Test Results Charts and Graphs can offer several benefits for data interpretation, including
A) Enhanced clarity and quick comprehension: Visual representations through blood test results in abbreviations charts can make it easier to see and understand complex data patterns.
B) Facilitated trend analysis and pattern recognition: Also, charts and graphs can help healthcare professionals identify trends and patterns in blood chemistry test results. Further, this can be useful for diagnosing and monitoring medical conditions. Also, it is facilitated using blood analysis software.
III. How to Use the Visual Guide Effectively?
To use the visual guide effectively, healthcare professionals should:
A) Firstly, select the appropriate chart for blood test results or graph for the blood chemistry parameters of interest.
B) Then, compare the patient’s results to the reference range.
C) Further, look for trends and patterns in the results.
D) Now, use the chart for blood test results and correlate it with other relevant clinical information. This includes the patient’s medical history, physical examination findings, and other laboratory results.
4. Blood Chemistry Test Results Explained
I. Analyzing Individual Blood Chemistry Parameters After Tests
When interpreting blood chemistry test results, it is important to analyze individual parameters in the context of the patient’s overall clinical picture. For example, an elevated blood sugar level may be indicative of diabetes, but it could also be due to other factors, such as stress or infection.
II. Recognizing Patterns and Relationships Between Parameters
Blood chemistry test results are often interconnected, and recognizing patterns and relationships between parameters can provide valuable insights into a patient’s overall health. For example, high cholesterol levels and elevated blood pressure are both risk factors for cardiovascular disease.
III. Tips for Spotting Abnormalities and Trends
Some tips for spotting abnormalities and trends in blood chemistry test results are:
A) Firstly, compare the patient’s results to the reference range.
B) Secondly, look for significant changes in results over time.
C) Thirdly, identify discrepancies between related parameters.
5. Case Studies and Examples
Case studies and examples can illustrate the practical application of the visual guide in different scenarios. For example, a case study could detail how a healthcare professional used the chart for blood test results to diagnose a patient with diabetes.
I. Real-world Cases with Blood Chemistry Test Results
Case 1: A 55-year-old man with a history of hypertension presents to his doctor with complaints of fatigue and polyuria (excessive urination). The doctor orders a blood chemistry test panel, which reveals the following results:
| Parameter | Result | Reference Range |
| Glucose | 160 mg/dL | 70-130 mg/dL |
| Cholesterol | 260 mg/dL | <200 mg/dL |
| Triglycerides | 200 mg/dL | <150 mg/dL |
The doctors with the help of blood test results abbreviations chart diagnose the patient with diabetes and hyperlipidemia. Also, the doctor discusses the patient’s treatment options and provides him with educational resources on diabetes and heart disease management.
Case 2: A 60-year-old woman with a history of chronic kidney disease presents to her doctor for a routine follow-up appointment. The doctor orders a blood chemistry test panel, which reveals the following results:
| Parameter | Result | Reference Range |
| Creatinine | 1.8 mg/dL | 0.7-1.3 mg/dL |
| eGFR | 45 mL/min/1.73 m2 | >60 mL/min/1.73 m2 |
By the blood chemistry interpretation, the doctor concludes that the patient’s kidney function has declined since her previous appointment. The doctor discusses the patient’s treatment options and provides her with educational resources on kidney disease management.
II. How to Apply the Visual Guide to Different Scenarios
The visual guide can be applied to a variety of different scenarios, such as:
A) Diagnosing and Monitoring Medical Conditions:
The visual guide helps in diagnosing and monitoring a wide range of medical conditions. Inclusive of diabetes, heart disease, kidney disease, and liver disease. Moreover, by analyzing individual parameters, recognizing patterns and relationships between parameters, and spotting abnormalities and trends, healthcare professionals can use the visual guide to make informed decisions about patient care.
B) Guiding Treatment Decisions:
The visual guide can also be used to guide treatment decisions. For example, a healthcare professional may use the visual guide to determine whether a patient with diabetes is responding well to treatment or if their treatment plan needs to be adjusted.
C) Identifying Patients at Risk:
The visual guide can also identify patients at risk for developing certain medical conditions. For example, a healthcare professional may use the visual guide to identify patients with high cholesterol levels who are at risk for developing heart disease.
6. Future Directions To Visual Blood Chemistry Reports
The field of blood chemistry testing is constantly evolving, with new tests being developed and existing tests being refined all the time. As a result, the visual guide in the form of a blood test results abbreviations chart will need to be updated regularly to reflect the latest advances in the field.
Additionally, new technologies like AI Blood Analysis are used for a deeper understanding of blood chemistry. This AI could also be used to develop more sophisticated visual guides. Furthermore, blood chemistry report software provides healthcare professionals with even more insights into blood chemistry test results. For example, AI-powered visual guides could be used to identify subtle patterns and trends that may be difficult for humans to detect.
Overall, the visual guide to blood chemistry test results is a valuable tool that has the potential to revolutionize the way that healthcare professionals diagnose, treat, and manage patients.
Conclusion
A visual guide to blood chemistry test results can be a valuable resource for decision-makers, empowering them to make informed decisions that improve patient care. Therefore, by simplifying the blood chemistry test interpretation of complex data and highlighting key findings, the visual guide can help healthcare professionals diagnose and monitor medical conditions, guide treatment decisions, and identify patients at risk.

